1

Previous: Running the simulation Up: Running the simulation and Next: Flow around the car

This is an automatically generated documentation by LaTeX2HTML utility. In case of any issue, please, contact us at info@cfdsupport.com.

Results Evaluation

uFieldMotorKombiPredek
uFieldMotorKombiZadek

Figure: OpenFOAM tutorial car case. Velocity field in xy plane and stream lines

  • Results can be watched in paraview by simply running paraFoam and populating the object pipeline by oneself.
  • Alternatively, one can use a preset pvsm visualization template by typing

    # paraFoam -touch
    # paraview

    and loading the template by File $ \rightarrow$ Load state.


  • NOTE: The absolute path to the *.OpenFOAM placeholder in loaded “state” file may differ from current path to the *.OpenFOAM placeholder. If the path is different ParaView ask you for it via “Fix Paths in State File” window.


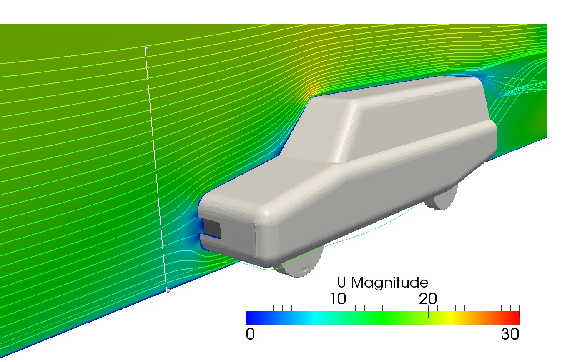
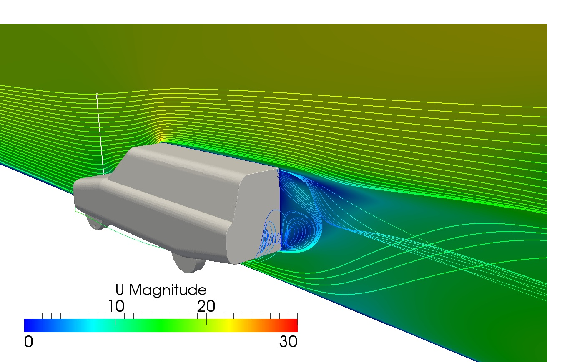
  • Choose uField.pvsm or pField.pvsm.


pFieldMotorKombi

Figure: OpenFOAM tutorial car case. Pressure field in xy plane and on a car body

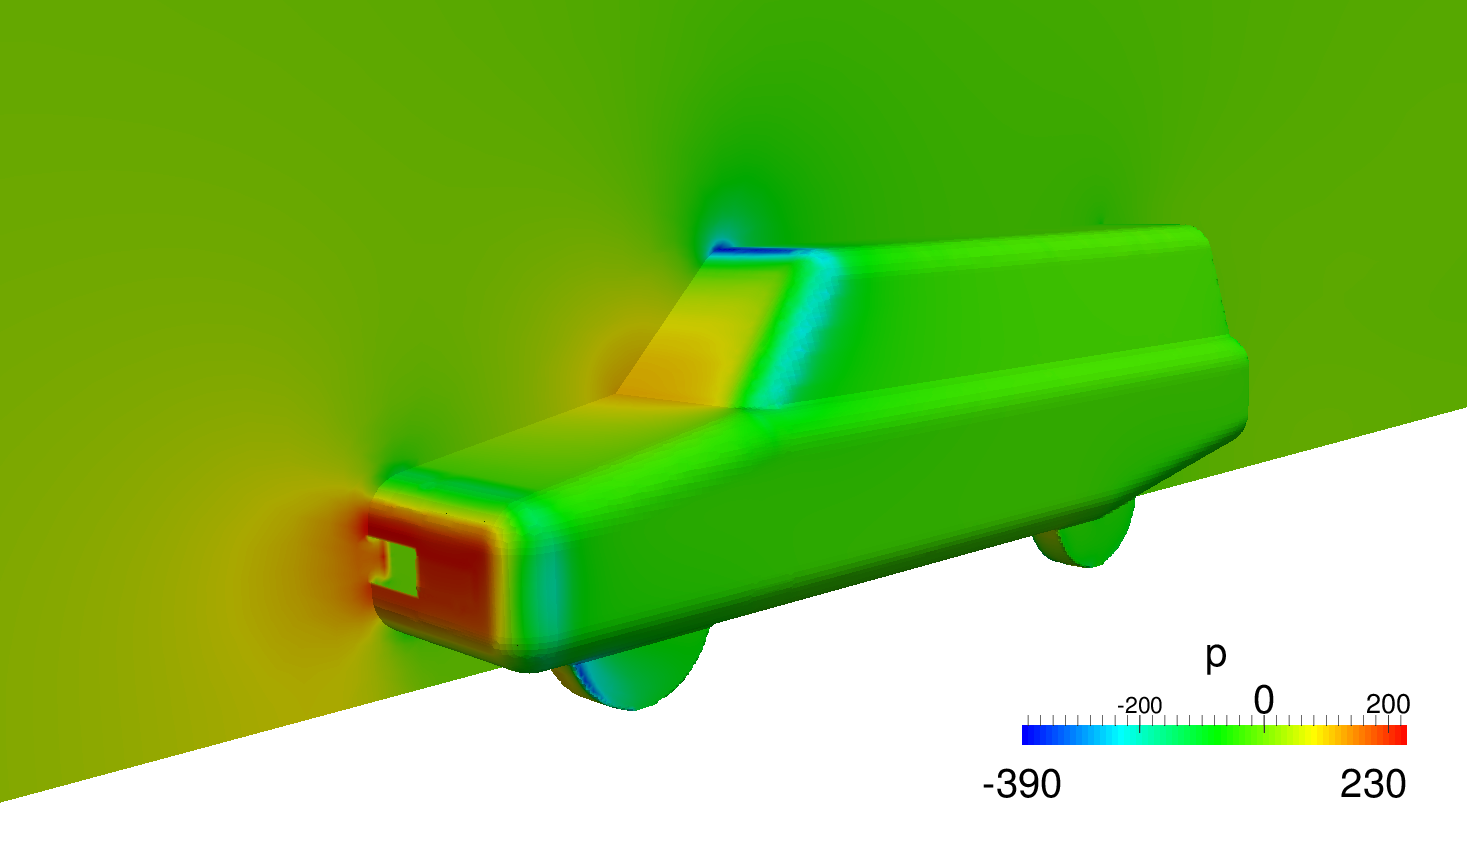
  • To obtain a better view of pressure field, set backface style in section Properties 17.4.
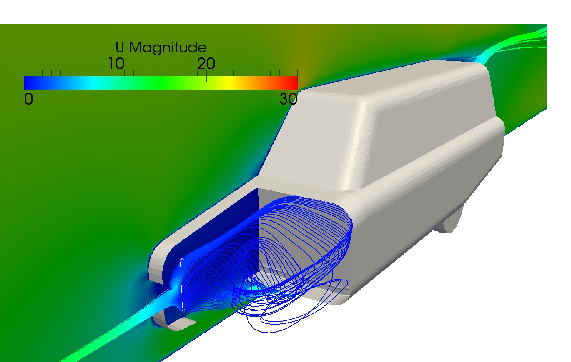
  • The template motor.pvsm shows the flow field in engine compartment in $ xy$ plane.


UrezMotor

Figure: OpenFOAM tutorial car case. Stream lines in engine compartment

  • To display the evolution of aerodynamic coefficients one can write a small script for gnuplot17.5 Run the script by typing gnuplot plotDragCoeffs.gp.


# Script for gnuplot

set xlabel "Iterations"
set ylabel "CdCoeff"
set grid
unset logscale y
set xrange [100:400]
set yrange [0.4:0.5]

plot "../carNoMotor/postProcessing/forces/0/forceCoeffs.dat" using 1:3 with line title 'Cd Car-M', \
     "postProcessing/forces/0/forceCoeffs.dat" using 1:3 with line title 'Cd Car+M'
pause mouse


openfoam tutorial car case Cd drag coefficients

Figure: OpenFOAM tutorial car case. Drag coefficients comparison $ C_d$ on very coarse grid.

  • Script for lift coefficients plotLiftCoeffs.gp comparison is very similar to the previous one.


# Script for gnuplot

set xlabel "Iterations"
set ylabel "ClCoeff"
set grid
unset logscale y
set xrange [100:400]
set yrange [-0.4:-0.2]

plot "../carNoMotor/postProcessing/forces/0/forceCoeffs.dat" using 1:4 with line title 'Cl Car-M', \
     "postProcessing/forces/0/forceCoeffs.dat" using 1:4 with line title 'Cl Car+M'
pause mouse
openfoam tutorial car case Cl lift coefficients

Figure: OpenFOAM tutorial car case. Lift coefficients comparison $ C_l$ on very coarse grid.