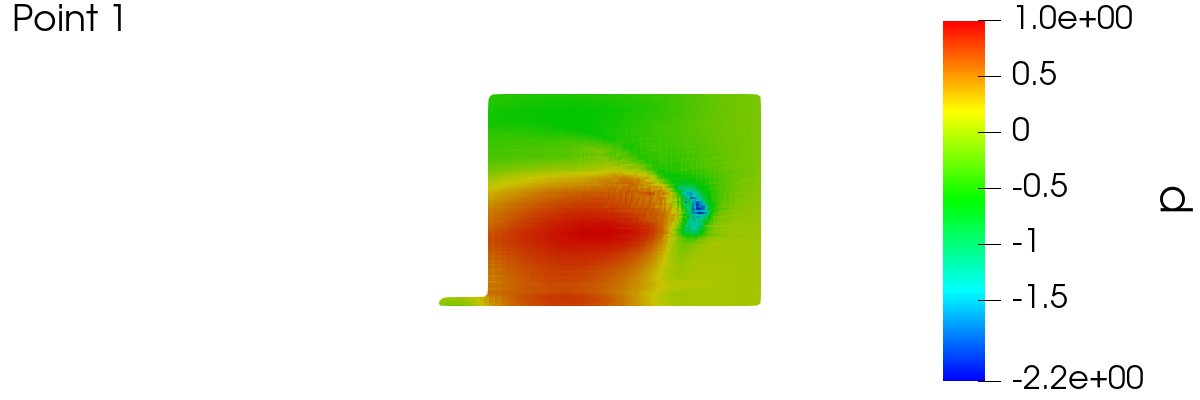
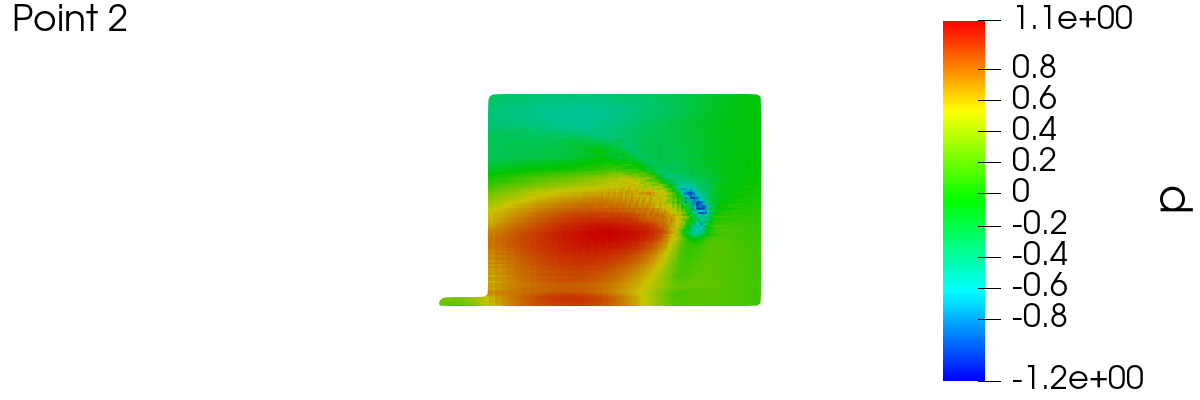
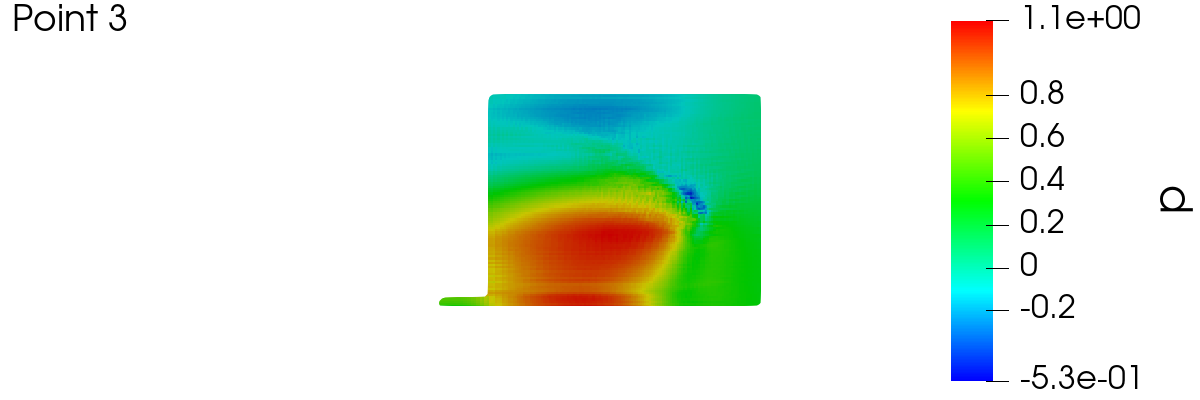
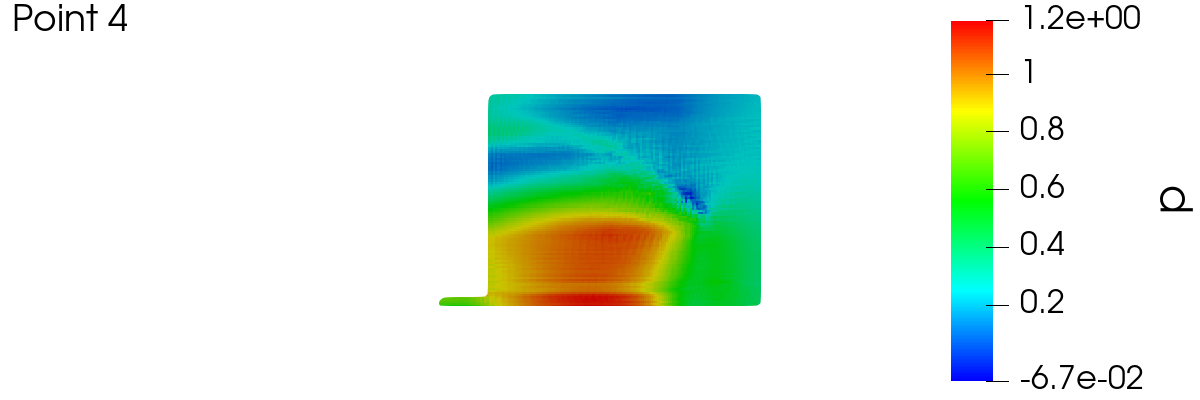
| Test Case Name |
ship-full-1 |
| Number of Points [ – ] |
5 |
| Machine Type |
propeller |
| Rotation Speed [ RPM ] |
570.000 |
|
Number of Components [ – ] (
) |
3 |
|
Mesh Size [ cells ] (
) |
Fluid : 1811345
Tail : 1206054
Propeller : 371690
Total : 3389089 |
|
Mesh details [ mm ]:
| Component |
Property |
Min |
Max |
Avg |
| 1 |
cellOpenness |
N/A |
4.44084 × 10⁻¹⁶
|
N/A |
| 1 |
cellVolume |
6.25530 |
1.53238 × 10⁸
|
N/A |
| 1 |
faceArea |
0.898698 |
302734. |
N/A |
| 1 |
aspectRatio |
N/A |
7.87219 |
N/A |
| 1 |
nonOrthogonality |
N/A |
61.6700 |
13.2261 |
| 1 |
skewness |
N/A |
2.90831 |
N/A |
| 1 |
edgeLength |
0 |
565.468 |
N/A |
| 1 |
concaveAngle |
N/A |
76.0280 |
N/A |
| 1 |
faceFlatness |
0.571006 |
N/A |
0.998747 |
| 1 |
cellDeterminant |
0.0587926 |
N/A |
19.8681 |
| 1 |
faceInterpolationWeight |
0.105795 |
N/A |
0.448111 |
| 1 |
faceVolumeRatio |
0.0238806 |
0.730624 |
N/A |
| 1 |
Warnings: |
438 faces with low quality or negative volume decomposition tets
14 points on short edges
8440 faces with concave angles
2 warped faces
170464 concave cells
|
| 2 |
cellOpenness |
N/A |
3.11095 × 10⁻¹⁶
|
N/A |
| 2 |
cellVolume |
0.0736455 |
905.025 |
N/A |
| 2 |
faceArea |
0.134414 |
235.185 |
N/A |
| 2 |
aspectRatio |
N/A |
15.0490 |
N/A |
| 2 |
nonOrthogonality |
N/A |
72.6536 |
11.4584 |
| 2 |
skewness |
N/A |
2.66250 |
N/A |
| 2 |
edgeLength |
N/A |
N/A |
N/A |
| 2 |
concaveAngle |
N/A |
N/A |
N/A |
| 2 |
faceFlatness |
0.878002 |
N/A |
0.999090 |
| 2 |
cellDeterminant |
0 |
N/A |
1.72222 |
| 2 |
faceInterpolationWeight |
0.107015 |
N/A |
0.470008 |
| 2 |
faceVolumeRatio |
0.116356 |
0.900458 |
N/A |
| 2 |
Warnings: |
682476 unordered faces
12 non-orthogonal faces
151 under-determined cells
|
| 3 |
cellOpenness |
N/A |
3.80374 × 10⁻¹⁶
|
N/A |
| 3 |
cellVolume |
0.351770 |
125.654 |
N/A |
| 3 |
faceArea |
0.285856 |
46.1108 |
N/A |
| 3 |
aspectRatio |
N/A |
24.8254 |
N/A |
| 3 |
nonOrthogonality |
N/A |
83.6654 |
42.6829 |
| 3 |
skewness |
N/A |
2.43557 |
N/A |
| 3 |
edgeLength |
N/A |
N/A |
N/A |
| 3 |
concaveAngle |
N/A |
N/A |
N/A |
| 3 |
faceFlatness |
0.988174 |
N/A |
0.999835 |
| 3 |
cellDeterminant |
0.00273959 |
N/A |
1.82270 |
| 3 |
faceInterpolationWeight |
0.0435062 |
N/A |
0.483239 |
| 3 |
faceVolumeRatio |
0.0449488 |
0.922343 |
N/A |
| 3 |
Warnings: |
379863 unordered faces
19950 non-orthogonal faces
55 faces with low interpolation weights
|
|
| Simulation score [ – ] |
|
|
| Point |
flow rate |
bounding |
residuals |
| 1 |
 |
 |
 |
| 2 |
 |
 |
 |
| 3 |
 |
 |
 |
| 4 |
 |
 |
 |
| 5 |
 |
 |
 |
|
| Average y+ at walls [ – ] |
|
|
y+ details:
| Point |
Patch |
Min |
Max |
Avg |
| 1 |
Fluid_MAIN_HULL_wall |
1.07086 |
59.2375 |
29.8705 |
| 1 |
Fluid_WALL_wall |
2260.14 |
3925.33 |
3623.91 |
| 1 |
Tail_TAIL-BOYI-2_wall |
1.53691 |
26.7594 |
11.5122 |
| 1 |
Tail_TAIL_wall |
0.890869 |
27.5236 |
12.3970 |
| 1 |
Tail_RUDDER_wall |
0.513620 |
342.731 |
63.5209 |
| 1 |
Tail_TAIL-BOYI-1_wall |
0.766456 |
19.1117 |
11.4982 |
| 1 |
Propeller_BACK_wall |
9.10416 |
446.703 |
89.4811 |
| 1 |
Propeller_FACE_wall |
3.88801 |
470.322 |
82.8375 |
| 1 |
Propeller_HUB_wall |
15.6722 |
126.212 |
74.5143 |
| 1 |
Propeller_BACK1_wall |
12.6922 |
431.755 |
121.062 |
| 1 |
Propeller_FACE1_wall |
9.33199 |
440.116 |
110.266 |
| 2 |
Fluid_MAIN_HULL_wall |
1.72495 |
107.968 |
54.9024 |
| 2 |
Fluid_WALL_wall |
2330.78 |
7431.99 |
6356.25 |
| 2 |
Tail_TAIL-BOYI-2_wall |
2.39115 |
31.2618 |
12.1728 |
| 2 |
Tail_TAIL_wall |
1.66134 |
32.2545 |
15.1837 |
| 2 |
Tail_RUDDER_wall |
0.711759 |
310.153 |
64.6531 |
| 2 |
Tail_TAIL-BOYI-1_wall |
1.09837 |
26.3645 |
12.2300 |
| 2 |
Propeller_BACK_wall |
13.1426 |
464.474 |
115.252 |
| 2 |
Propeller_FACE_wall |
8.62975 |
448.230 |
101.478 |
| 2 |
Propeller_HUB_wall |
11.1573 |
126.000 |
76.3612 |
| 2 |
Propeller_BACK1_wall |
18.1591 |
474.205 |
145.342 |
| 2 |
Propeller_FACE1_wall |
17.0575 |
426.044 |
123.231 |
| 3 |
Fluid_MAIN_HULL_wall |
1.64310 |
156.610 |
79.2624 |
| 3 |
Fluid_WALL_wall |
2268.16 |
10831.7 |
8554.60 |
| 3 |
Tail_TAIL-BOYI-2_wall |
2.34393 |
37.3333 |
14.6837 |
| 3 |
Tail_TAIL_wall |
8.64886 |
32.5874 |
18.1032 |
| 3 |
Tail_RUDDER_wall |
9.44731 |
279.651 |
64.9691 |
| 3 |
Tail_TAIL-BOYI-1_wall |
1.10235 |
25.3220 |
14.5229 |
| 3 |
Propeller_BACK_wall |
13.4192 |
490.327 |
135.629 |
| 3 |
Propeller_FACE_wall |
11.1908 |
439.086 |
120.795 |
| 3 |
Propeller_HUB_wall |
11.5509 |
131.958 |
80.8925 |
| 3 |
Propeller_BACK1_wall |
19.1086 |
504.474 |
160.671 |
| 3 |
Propeller_FACE1_wall |
18.8502 |
450.112 |
129.840 |
| 4 |
Fluid_MAIN_HULL_wall |
1.63112 |
204.468 |
102.934 |
| 4 |
Fluid_WALL_wall |
2239.90 |
14115.0 |
10174.7 |
| 4 |
Tail_TAIL-BOYI-2_wall |
3.21459 |
47.9845 |
18.2711 |
| 4 |
Tail_TAIL_wall |
11.2048 |
41.5995 |
23.0515 |
| 4 |
Tail_RUDDER_wall |
9.49174 |
294.317 |
65.2091 |
| 4 |
Tail_TAIL-BOYI-1_wall |
1.69795 |
31.2039 |
17.7401 |
| 4 |
Propeller_BACK_wall |
14.7311 |
521.810 |
131.954 |
| 4 |
Propeller_FACE_wall |
13.3136 |
479.618 |
129.998 |
| 4 |
Propeller_HUB_wall |
15.4238 |
162.747 |
90.6529 |
| 4 |
Propeller_BACK1_wall |
18.9803 |
514.950 |
164.751 |
| 4 |
Propeller_FACE1_wall |
22.1700 |
471.913 |
136.522 |
| 5 |
Fluid_MAIN_HULL_wall |
1.63318 |
232.803 |
116.803 |
| 5 |
Fluid_WALL_wall |
2229.32 |
16019.8 |
10881.9 |
| 5 |
Tail_TAIL-BOYI-2_wall |
3.48583 |
53.8777 |
20.1782 |
| 5 |
Tail_TAIL_wall |
11.5863 |
46.8315 |
26.0595 |
| 5 |
Tail_RUDDER_wall |
10.2586 |
292.236 |
67.4576 |
| 5 |
Tail_TAIL-BOYI-1_wall |
1.98076 |
34.9776 |
19.5077 |
| 5 |
Propeller_BACK_wall |
15.0575 |
537.901 |
131.538 |
| 5 |
Propeller_FACE_wall |
15.0139 |
503.596 |
131.530 |
| 5 |
Propeller_HUB_wall |
13.7399 |
179.054 |
98.0418 |
| 5 |
Propeller_BACK1_wall |
17.5344 |
505.071 |
163.359 |
| 5 |
Propeller_FACE1_wall |
22.6587 |
484.083 |
139.031 |
|
| Wall-clock time [ hh:mm:ss ] |
00:01:31 (meshing)
04:01:55 (calculation)
|
| Parallel Processors [ – ] |
24 |
| Fluid Name |
water |
| Physical Model |
incompressible |
| Numerical order |
second |
| Turbulence model |
kOmegaSST |
