


- Important information is the computation convergence
- All important data are printed to standard output
- When running the simulation the convergence data can be forwarded to the file e.g.:
# simpleFoam > log & - To analyze computation convergence use OpenFOAM utility foamLog, which extract data from log file
- You can list data from log file:
# foamLog -l log - Output is following:
clockTime
contCumulative
contGlobal
contLocal
epsAvg
epsilon
epsilonFinalRes
epsilonIters
epsMax
epsMin
executionTime
k
kFinalRes
kIters
p
pFinalRes
pIters
Separator
Time
Ux
UxFinalRes
UxIters
Uy
UyFinalRes
UyIters
- Information about convergence of all quantities
 are stored
 - Initial residual are epsilon, k, p, Ux, Uy
- Final residual are *FinalRes
- Number of iterations of linear system solver *Iters
- Total computation time executionTime
- Continuity error contCumulative, contGlobal, contLocal
- Run foamLog on log file called e.g. log:
# foamLog log - Output is following:
Using:
  log      : log.simpleFoam
  database : /mnt/home/sevcik/OpenFOAM/CFDSupportFOAMdev/beta/OpenFOAM-dev/bin/tools/foamLog.db
  awk file : ./logs/foamLog.awk
  files to : ./logs

Executing: awk -f ./logs/foamLog.awk log.simpleFoam

Generated XY files for:
clockTime
contCumulative
contGlobal
contLocal
epsAvg
epsilon
epsilonFinalRes
epsilonIters
epsMax
epsMin
executionTime
k
kFinalRes
kIters
p
pFinalRes
pIters
Separator
Time
Ux
UxFinalRes
UxIters
Uy
UyFinalRes
UyIters
End
- Now, data is in directory ./logs
- Go to the directory logs:
# cd logs - List the directory:
# lsclockTime_0 epsAvg_0 epsMax_0 k_0 pFinalRes_0 Ux_0 UyFinalRes_0 contCumulative_0 epsilon_0 epsMin_0 kFinalRes_0 pIters_0 UxFinalRes_0 UyIters_0 contGlobal_0 epsilonFinalRes_0 executionTime_0 kIters_0 Separator_0 UxIters_0 contLocal_0 epsilonIters_0 foamLog.awk p_0 Time_0 Uy_0
- File have format ASCII ”time layer; value“
- To plot data use open-source program gnuplot
- Run gnuplot (in same way as before, according to your OS).
- In gnuplot environment write command:
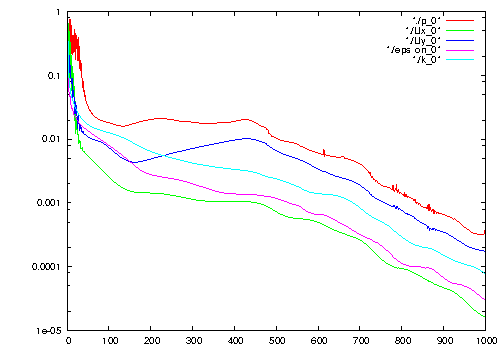
gnuplot> set logscale y # sets logarithmic scale of y axis
gnuplot> plot './p_0' with lines, './Ux_0' with lines, './Uy_0' with lines, './epsilon_0' with lines, './k_0' with lines # plots residuals